01 · Validate the data
Reconcile booking facts, workshop labels, and independent daily completeness receipts.
The final volume · Part V
Turn synthetic Workshop Desk bookings into an attendance report. Check the source, calculate defensible metrics, and ship a report another person can reproduce.
12 chapters
12 chapters
Identify the meaning of one row before counting. Check keys, units and missing values. Keep an event log distinct from a snapshot.
Pages 5–77 · 8 casesDeclare the event window, calendar and data freeze. Distinguish a missing day from a delivered day that legitimately has zero observations.
Pages 78–150 · 8 casesReconcile counts as records move through validation. Hold conflicting facts, assign reason codes and preserve provenance.
Pages 151–223 · 8 casesUse dimension keys and time-valid attributes to enrich facts. Check for fan-out, unmatched rows and incomplete dimension coverage.
Pages 224–296 · 8 casesWrite metric definitions with an explicit numerator and denominator. Separate unavailable rates, genuine zeros, changes in points and relative changes.
Pages 337–409 · 8 casesDescribe center and spread without hiding unusual observations. State the quantile method, sample size and how flagged values were handled.
Pages 410–482 · 8 casesDefine time and segment cohorts consistently. Compare changes within groups and check whether the overall result moved because the mix changed.
Pages 483–555 · 8 casesRepresent uncertainty without overstating what the data can support. Check sample assumptions, association and reproducibility.
Pages 556–628 · 8 casesCompare periods or experiment groups using common definitions. Consider assignment, crossover, guardrails and outside changes before claiming an effect.
Pages 669–741 · 8 casesChoose a chart that expresses the measure. Use honest scales, label the unit and provide equivalent values in an accessible table.
Pages 742–814 · 8 casesReview what an aggregate release could reveal. Keep small values out of all output forms and look for totals or overlapping releases that expose them.
Pages 815–887 · 8 casesFreeze report definitions and compare reruns. Ship the fixtures, source, output and checks someone else needs to reproduce the result.
Pages 888–960 · 8 casesThree connected projects
Open the worked attendance report
Reconcile booking facts, workshop labels, and independent daily completeness receipts.
Calculate rates with explicit denominators, compare segments, and suppress small groups in the classroom report.
Build accessible HTML and SVG from one report object, then verify repeat builds with a manifest.
Look inside
Try a data-grain case in the free 16-page excerpt. Preview the source pages from each project.
The series
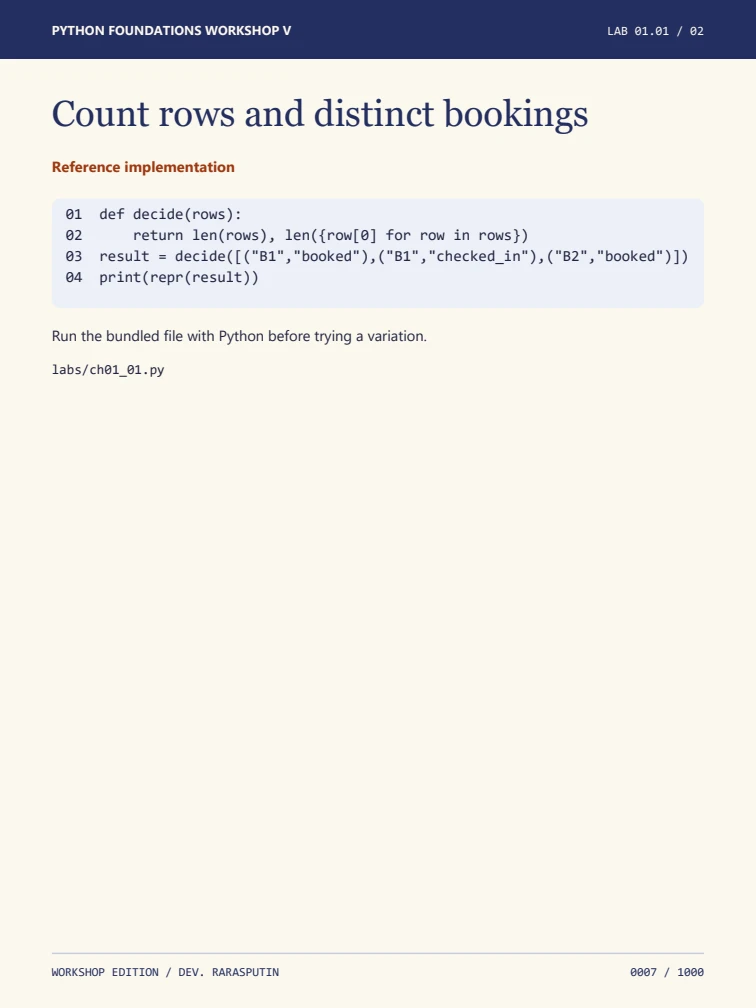
The PDF and ZIP include 96 runnable cases with assertions and recorded output, a project suite with tests, and a curriculum index. Use Python 3.12 or newer.
Gumroad listing pending · $20 USD
The free sample and worked report are available now.